The Age of a Roof and The Price You Pay: New Analysis of Hurricane Risk in the U.S.
Tom Sabbatelli-GoodyerMarch 02, 2017
RMS has completed research on hurricane risk to single-family dwellings using an improved understanding of roof age, which can lead to more accurate loss projections using our models
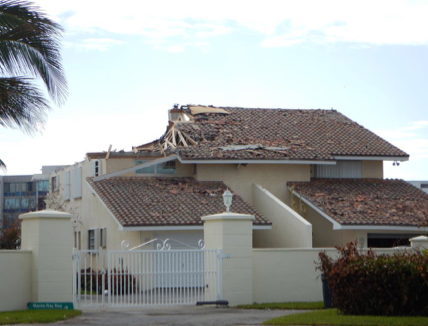
Residential gable end roof failure in the Bahamas, observed following Hurricane Matthew
Weak roofs mean losses during hurricanes. During reconnaissance trips to the southeast U.S. and the Bahamas following Hurricane Matthew last fall, RMS experts saw ample evidence of this simple fact. Their on-the-ground survey highlighted everything from shingle and tile damage to complete roof failures.
Roof weakness significantly influences RMS’ view of structural vulnerability in our North Atlantic Hurricane models, which can factor in a roof’s age, covering, and shape into calculations of potential loss. However, this valuable property data is not captured by many insurers, and this could represent a missed business opportunity to improve underwriting – whether it be pricing or risk selection.
Extending the Data, Refining the Insights
RMS already has a dataset of hurricane claims from over one million single-family dwelling (SFD) homes in Florida and the northeast U.S., representing $240 billion in total insured value. However, this dataset lacks roof characteristics for a majority of the homes, so we augmented it with roof age information obtained from BuildFax, which holds detailed building characteristics for over 90 million properties in over 10,000 U.S. cities and counties. From this enhanced dataset we found:
About 70 percent of Florida homes (SFDs) had roofs aged 10 years or older at the time of the 2004-05 hurricanes
Roughly half of the Northeast homes (SFDs) had roofs aged 20 years or older at the time of Superstorm Sandy (2012)
Only 20% of all homes (SFDs) still had their original roofs, although this proportion was lower for coastal properties than for inland properties
So what was the relationship between roof age and losses? In the second stage of our research, our vulnerability modelers paired the exposure data with 182,000 hurricane claims, totaling $2.25 billion in paid losses, to look for patterns related to roof age.
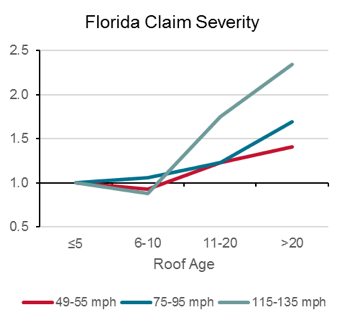
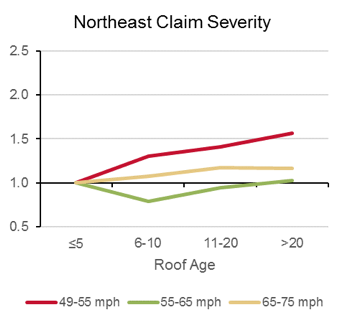
Normalized severity of Florida claims from the 2004-05 hurricanes, by roof age and selected wind speed bands, for all risk classesNormalized severity of Northeast claims from Sandy, by roof age and selected wind speed bands, for all risk classes
As expected, we found that homes with older roofs generally corresponded with more claims, and claims of greater severity. This was most evident at the low wind speeds experienced in the Northeast U.S. during Superstorm Sandy, as well as at higher wind speeds experienced in the Florida hurricanes. These graphs show that buildings in Florida with a roof older than 20 years are associated with claims that are between 50-100% more severe, compared with buildings having a roof less than five years old. A similar trend appears in the Northeast, but is muted because of the smaller dataset.
That’s the picture from historical data. But what about modeling potential future events? To answer that question we analyzed the enlarged Florida dataset, focusing on how roof age at a particular location compares to the industry average for that region.
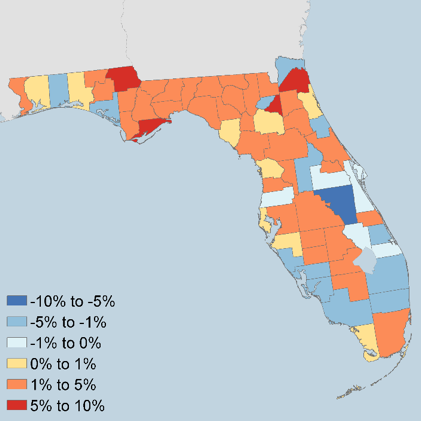
Change in modeled AAL by Florida county when including roof age information from BuildFax
The change in modeled average annual loss (AAL) by county shows a patchwork of increased and decreased risk that corresponds to the average roof age of properties in each county.
So we can see that using roof age data leads to significant differences in modeled loss within regions.
That’s a valuable insight in itself. But we decided to drill down a little deeper.
From counties to ZIP codes to individual locations
Although the maximum change in AAL was less than 10% at the county level, changes of up to 20% were observed at the level of ZIP codes. These results show that improved understanding of predominant roof age could influence a company to change its regional underwriting strategy or refine its rating territories.
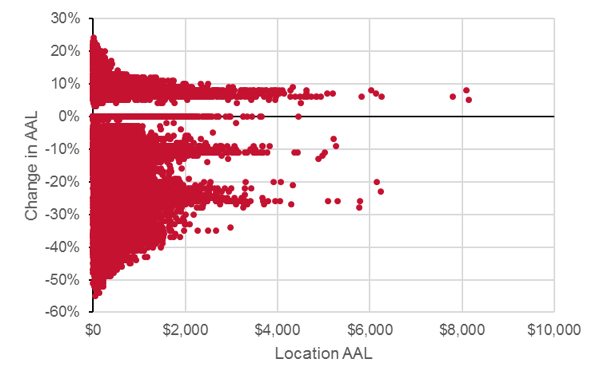
Going more granular still, within each county and ZIP code there is variation in the roof age of individual homes and this is critical to consider when writing new business. The scatter plot below shows the change in AAL at individual locations. Those homes with older roofs produce higher than average AAL and vice versa.
Change in modeled AAL by location when including roof age information. “Location AAL” (x-axis) represents AAL without roof age
So when we go down to the level of individual locations the impact of roof age data leads to loss changes of up to 50%, demonstrating higher significance than at the regional level. For high hurricane risk locations in Florida with large baseline AALs, this change translates into substantial dollar amounts. That’s crucial to know, revealing key opportunities to improve underwriting practices. For instance, companies might choose to quote more competitively on price for properties with newer roofs.
Unsurprisingly, over time strengthened building codes and practices have led to stronger roofs that are more resilient to hurricane damage. But this research tells us much more – the sheer magnitude of modeled loss changes observed was significant, with clear implications for profitability, as explained by BuildFax CEO Holly Tachovsky:
“These results reveal key opportunities to improve underwriting practices, including pricing and risk selection. A focus on roof age can be the difference-maker for loss ratios in certain geographies. As a result, we see a growing level of sophistication among carriers that want to rate and select with a higher degree of accuracy.”
RMS remains committed to partnerships with industry experts like BuildFax to communicate the business benefits of emerging trends in the (re)insurance space.
Share:
You May Also Like
March 31, 2021
RMS 2020 Catastrophe Review: The Year of the COVID-19 Pandemic
Tom is a Director - Event Response at RMS, and leads the Event Response services operation. He joined RMS in 2009 and spent several years in the Client Support Services organization, primarily providing specialist peril model support. Tom joined RMS upon completion of his bachelor's and master's degrees in meteorology from Pennsylvania State University, where he studied the statistical influence of climate state variables on tropical cyclone frequency. He is a member of the American Meteorological Society (AMS).