Earthquake Hazard: What Has New Zealand’s Kaikoura Earthquake Taught Us So Far?
Megan ArnoldDecember 01, 2016
The northeastern end of the South Island is a tectonically complex region with the plate motion primarily accommodated through a series of crustal faults. On November 14, as the Kaikoura earthquake shaking began, multiple faults ruptured at the same time culminating in a Mw 7.8 event (as reported by GNS Science).
The last two weeks have been busy for earthquake modelers. The paradox of our trade is that while we exist to help avoid the damage this natural phenomenon causes, the only way we can fully understand this hazard is to see it in action so that we can refine our understanding and check that our science provides the best view of risk. Since November 14 we have been looking at what Kaikoura tells us about our latest, high-definition New Zealand Earthquake model, which was designed to handle such complex events.
Multiple-Segment Ruptures
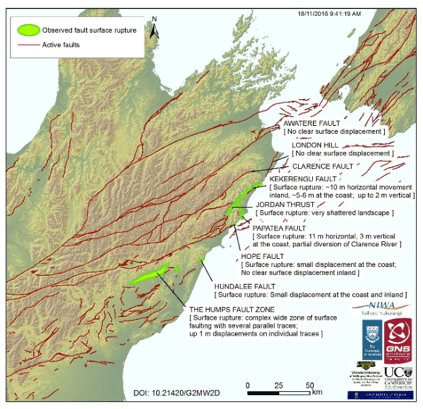
With the Kaikoura earthquake’s epicenter at the southern end of the faults identified, the rupture process moved from south to north along this series of interlinked faults (see graphic below). Multi-fault rupture is not unique to this event as the same process occurred during the 2010 Mw 7.2 Darfield Earthquake. Such ruptures are important to consider in risk modeling as they produce events of larger magnitude, and therefore affect a larger area, than individual faults would on their own.
Map showing the faults identified by GNS Sciences as experiencing surface fault rupture in the Kaikoura Earthquake.
Source: http://info.geonet.org.nz/display/quake/2016/11/16/Ruptured +land%3A+observations+from+the+air
In keeping with the latest scientific thinking, the New Zealand Earthquake HD Model provides an expanded suite of events that represent complex ruptures along multiple faults. For now, these are included only for areas of high slip fault segments in regions with exposure concentrations, but their addition increases the robustness of the tail of the Exceedance Probability curve, meaning clients get a better view of the risk of the most damaging, but lower probability events.
Landsliding and Liquefaction
While most property damage has been caused directly by shaking, infrastructure has been heavily impacted by landsliding and, to a lesser extent, liquefaction. Landslides and slumps have occurred across the region, most notably over Highway 1, an arterial route. The infrastructure impacts of the Kaikoura earthquake are a likely dress rehearsal for the expected event on the Alpine Fault. This major fault runs 600 km along the western coast of the South Island and is expected to produce an Mw 8+ event with a probability of 30% in the next 50 years, according to GNS Science.
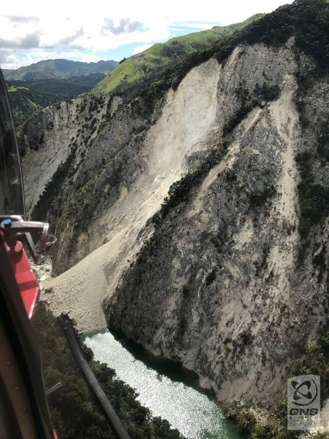
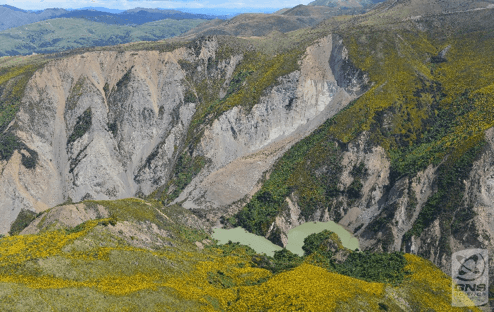
As many as 80 – 100,000 landslides have been reported in the upper South Island, with some creating temporary dams over rivers and in some cases temporary lakes (see below). These dams can fail catastrophically, sending a sudden increase of water flow down the river.
Examples of rivers blocked by landslides photographed by GNS Science researchers.
Liquefaction occurred in discrete areas across the region impacted by the Kaikoura earthquake. The Port of Wellington experienced both lateral and vertical deformation likely due to liquefaction processes in reclaimed land. There have been reports of liquefaction near the upper South Island towns (Blenheim, Seddon, Ward), but liquefaction will not be a driver of loss in the Kaikoura event to the extent it was in the Christchurch earthquake sequence.
RMS’ New Zealand Earthquake HD Model includes a new liquefaction component that was derived using the immense amount of new borehole data collected after the Canterbury Earthquake Sequence in 2010-2011. This new methodology considers additional parameters, such as depth to the groundwater table and soil-strength characteristics, that lead to better estimates of lateral and vertical displacement. The HD model is the first probabilistic model with a landslide susceptibility component for New Zealand.
Tsunami
The Kaikoura Earthquake generated tsunami waves that were observed in Kaikoura at 2.5m, Christchurch at 1m, and Wellington at 0.5m. The tsunami waves arrived in Kaikoura significantly earlier than in Christchurch and Wellington indicating that the tsunami was generated near Kaikoura. The waves were likely generated by offshore faulting, but also may be associated with submarine landsliding. Fortunately, the scale of the tsunami waves did not produce significant damage. RMS’ latest New Zealand Earthquake HD Model captures tsunami risk due to local ocean bottom deformation caused by fault rupture, and is the first model in the New Zealand market to do this, that is built from a fully hydrodynamic model.
Next Generation Earthquake Modeling at RMS
Thankfully the Kaikoura earthquake seems to have produced damage that is lower than we might have seen had it hit a more heavily populated area of New Zealand with greater exposures – for detail on damage please see my other blog on this event.
But what Kaikoura has told us is that our latest HD model offers an advanced view of risk. Released only in September 2016, it was designed to handle such a complex event as the Kaikoura earthquake, featuring multiple-segment ruptures, a new liquefaction model at very high resolution, and the first landslide susceptibility model for New Zealand.
Share:
You May Also Like
November 30, 2016
New Zealand’s Kaikoura Earthquake: What Have We Learned So Far About Damage?
Liquefaction: A Wider-spread Problem Than Might Be Appreciated
Everyone has known for decades that New Zealand is at serious risk of earthquakes. In his famous Earthquake Book, Cuthbert Heath, the pioneering Lloyd’s non-marine underwriter, set the rate for Christchurch higher than for almost any other place, back in 1914. Still, underwriters were fairly blasé about the risk until the succession of events in 2010-11 known as the Canterbury Earthquake Sequence (CES).
New Zealand earthquake risk had been written by reinsurers usefully for diversification; it was seen as uncorrelated with much else, and no major loss event had occurred since the Edgecumbe earthquake in 1987. Post-CES, however, the market is unrecognizable. More importantly, perhaps, it taught us a great deal about liquefaction, a soil phenomenon which can multiply the physical damage caused by moderate to large earthquakes, and is a serious hazard in many earthquake zones around the world, particularly those with near water bodies, water courses, and the ocean.
The unprecedented liquefaction observation data collected during the CES made a significant contribution to our understanding of the phenomenon, and the damage it may cause. Important to know is that the risk is not limited to New Zealand. Liquefaction has been a significant cause of damage during recent earthquakes in the United States, such as the 1989 Loma Prieta earthquake in the San Francisco Bay area and the devastating 1964 earthquake in Alaska which produced very serious liquefaction around Anchorage. Unsurprisingly, other parts of the world are also at risk, including the coastal regions of Japan, as seen in the 1995 Kobe and 1964 Niigata earthquakes, and Turkey. The 1999 Izmit earthquake produced liquefaction along the shorelines of Izmit Bay and also in the inland city of Adapazari situated along the Sakarya River. The risk is as high in regions that have not experienced modern earthquakes, such as the Seattle area, and in the New Madrid seismic zone along the Mississippi River.
2011 Lyttelton: observed and learned
Five years ago this week, the magnitude 6.3 Lyttelton (or Christchurch) Earthquake, the most damaging of the sequence, dealt insured losses of more than US $10 billion. It was a complex event both from scientific and industry perspectives. A rupture of approximately 14 kilometers occurred on a previously unmapped, dipping blind fault that trends east to northeast.[1] Although its magnitude was moderate, the rupture generated the strongest ground motions ever recorded in New Zealand. Intensities ranged between 0.6 and 1.0 g in Christchurch’s central business district, where for periods between 0.3 and 5 seconds the shaking exceeded New Zealand’s 500-year design standard.
The havoc wrought by the shaking was magnified by extreme liquefaction, particularly around the eastern suburbs of Christchurch. Liquefaction occurs when saturated, cohesion-less soil loses strength and stiffness in response to a rapidly applied load, and behaves like a liquid. Existing predictive models did not capture well the significant contribution of extreme liquefaction to land and building damage.
Figure 1: The photo on the left shows foundation failure due to liquefaction which caused the columns on the left side of the building to sink. The photo on the right shows a different location with evident liquefaction (note the silt around columns) and foundation settlement.Structural damage due to liquefaction and landslide accounted for a third of the insured loss to residential dwellings caused by the CES. Lateral spreading and differential settlement of the ground caused otherwise intact structures to tilt beyond repair. New Zealand’s government bought over 7,000 affected residential properties, even though some suffered very little physical damage, and red-zoned entire neighborhoods as too hazardous to build on.
Figure 2: Christchurch Area Residential Red-Zones And Commercial Building Demolitions (Source: Canterbury Earthquake Recovery Authority (CERA), March 5, 2015).Incorporating the learnings from Christchurch into the next model update
A wealth of new borehole data, ground motion recordings, damage statistics, and building forensics reports has contributed to a much greater understanding of earthquake hazard and local vulnerability in New Zealand. RMS, supported by local geotechnical expertise, has used the data to redesign completely how liquefaction is modeled. The RMS liquefaction module now considers more parameters, such as depth to groundwater table and certain soil-strength characteristics, all leading to better predictive capabilities for the estimate of lateral and vertical displacement at specific locations. The module now more accurately assesses potential damage to buildings based on two potential failure modes.
The forthcoming RMS New Zealand Earthquake HD Model includes pre-compiled events that consider the full definition of fault rupture geometry and magnitude. An improved distance-calculation approach enhances near-source ground motion intensity predictions. This new science, and other advances in RMS models, serve a vital role in post-CES best practice for the industry, as it faces more regulatory scrutiny than ever before.
Liquefaction risk around the world
Insurers in New Zealand and around the world are doing more than ever to understand their earthquake exposures, and to improve the quality of their data both for the buildings and the soils underneath them. In tandem, greater market emphasis is being placed on understanding the catastrophe models. Key, is the examination of the scientific basis for different views of risk, characterized by a deep questioning of the assumptions embedded within models. In the spotlight of ever-increasing scrutiny from regulators and stakeholders, businesses must now be able to articulate the drivers of their risk, and demonstrate that they are in compliance with solvency requirements. Reference to Cuthbert Heath’s rate—or the hazard as assessed last year—is no longer enough.
[1] Bradley BA, Cubrinovski M. Near-source strong ground motions observed in the 22 February 2011 Christchurch Earthquake. Seismological Research Letters 2011. Vol. 82 No. 6, pp 853-865.…
As a member of the Model Product Management team, Megan manages the development, delivery, and subject matter support of earthquake models. She is currently focused on the New Zealand Earthquake HD Model while managing the Europe Earthquake Model and global earthquake hazard data products. Megan holds a Bachelor’s of Science in geology from Bates College and the RMS Certified Catastrophe Risk Analyst (CCRA®) designation.