Liquefaction: A Wider-spread Problem Than Might Be Appreciated
Megan ArnoldFebruary 25, 2016
Everyone has known for decades that New Zealand is at serious risk of earthquakes. In his famous Earthquake Book, Cuthbert Heath, the pioneering Lloyd’s non-marine underwriter, set the rate for Christchurch higher than for almost any other place, back in 1914. Still, underwriters were fairly blasé about the risk until the succession of events in 2010-11 known as the Canterbury Earthquake Sequence (CES).
New Zealand earthquake risk had been written by reinsurers usefully for diversification; it was seen as uncorrelated with much else, and no major loss event had occurred since the Edgecumbe earthquake in 1987. Post-CES, however, the market is unrecognizable. More importantly, perhaps, it taught us a great deal about liquefaction, a soil phenomenon which can multiply the physical damage caused by moderate to large earthquakes, and is a serious hazard in many earthquake zones around the world, particularly those with near water bodies, water courses, and the ocean.
The unprecedented liquefaction observation data collected during the CES made a significant contribution to our understanding of the phenomenon, and the damage it may cause. Important to know is that the risk is not limited to New Zealand. Liquefaction has been a significant cause of damage during recent earthquakes in the United States, such as the 1989 Loma Prieta earthquake in the San Francisco Bay area and the devastating 1964 earthquake in Alaska which produced very serious liquefaction around Anchorage. Unsurprisingly, other parts of the world are also at risk, including the coastal regions of Japan, as seen in the 1995 Kobe and 1964 Niigata earthquakes, and Turkey. The 1999 Izmit earthquake produced liquefaction along the shorelines of Izmit Bay and also in the inland city of Adapazari situated along the Sakarya River. The risk is as high in regions that have not experienced modern earthquakes, such as the Seattle area, and in the New Madrid seismic zone along the Mississippi River.
2011 Lyttelton: observed and learned
Five years ago this week, the magnitude 6.3 Lyttelton (or Christchurch) Earthquake, the most damaging of the sequence, dealt insured losses of more than US $10 billion. It was a complex event both from scientific and industry perspectives. A rupture of approximately 14 kilometers occurred on a previously unmapped, dipping blind fault that trends east to northeast.[1] Although its magnitude was moderate, the rupture generated the strongest ground motions ever recorded in New Zealand. Intensities ranged between 0.6 and 1.0 g in Christchurch’s central business district, where for periods between 0.3 and 5 seconds the shaking exceeded New Zealand’s 500-year design standard.
The havoc wrought by the shaking was magnified by extreme liquefaction, particularly around the eastern suburbs of Christchurch. Liquefaction occurs when saturated, cohesion-less soil loses strength and stiffness in response to a rapidly applied load, and behaves like a liquid. Existing predictive models did not capture well the significant contribution of extreme liquefaction to land and building damage.
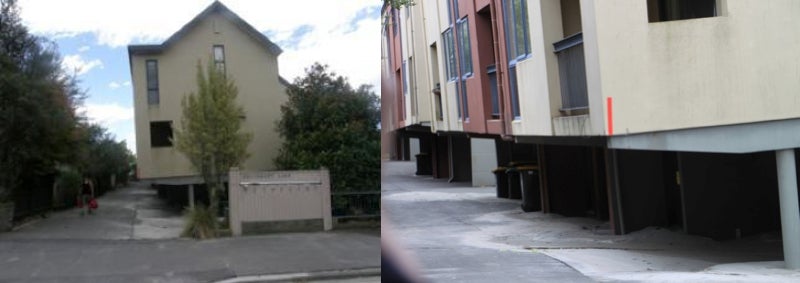
Figure 1: The photo on the left shows foundation failure due to liquefaction which caused the columns on the left side of the building to sink. The photo on the right shows a different location with evident liquefaction (note the silt around columns) and foundation settlement.
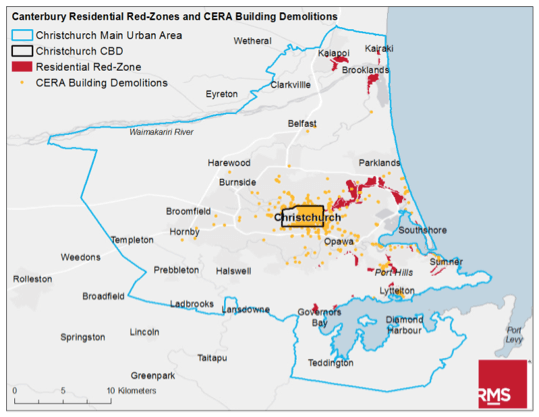
Structural damage due to liquefaction and landslide accounted for a third of the insured loss to residential dwellings caused by the CES. Lateral spreading and differential settlement of the ground caused otherwise intact structures to tilt beyond repair. New Zealand’s government bought over 7,000 affected residential properties, even though some suffered very little physical damage, and red-zoned entire neighborhoods as too hazardous to build on.
Figure 2: Christchurch Area Residential Red-Zones And Commercial Building Demolitions (Source: Canterbury Earthquake Recovery Authority (CERA), March 5, 2015).
Incorporating the learnings from Christchurch into the next model update
A wealth of new borehole data, ground motion recordings, damage statistics, and building forensics reports has contributed to a much greater understanding of earthquake hazard and local vulnerability in New Zealand. RMS, supported by local geotechnical expertise, has used the data to redesign completely how liquefaction is modeled. The RMS liquefaction module now considers more parameters, such as depth to groundwater table and certain soil-strength characteristics, all leading to better predictive capabilities for the estimate of lateral and vertical displacement at specific locations. The module now more accurately assesses potential damage to buildings based on two potential failure modes.
The forthcoming RMS New Zealand Earthquake HD Model includes pre-compiled events that consider the full definition of fault rupture geometry and magnitude. An improved distance-calculation approach enhances near-source ground motion intensity predictions. This new science, and other advances in RMS models, serve a vital role in post-CES best practice for the industry, as it faces more regulatory scrutiny than ever before.
Liquefaction risk around the world
Insurers in New Zealand and around the world are doing more than ever to understand their earthquake exposures, and to improve the quality of their data both for the buildings and the soils underneath them. In tandem, greater market emphasis is being placed on understanding the catastrophe models. Key, is the examination of the scientific basis for different views of risk, characterized by a deep questioning of the assumptions embedded within models. In the spotlight of ever-increasing scrutiny from regulators and stakeholders, businesses must now be able to articulate the drivers of their risk, and demonstrate that they are in compliance with solvency requirements. Reference to Cuthbert Heath’s rate—or the hazard as assessed last year—is no longer enough.
[1] Bradley BA, Cubrinovski M. Near-source strong ground motions observed in the 22 February 2011 Christchurch Earthquake. Seismological Research Letters 2011. Vol. 82 No. 6, pp 853-865.
Share:
You May Also Like
December 01, 2016
Earthquake Hazard: What Has New Zealand’s Kaikoura Earthquake Taught Us So Far?
As a member of the Model Product Management team, Megan manages the development, delivery, and subject matter support of earthquake models. She is currently focused on the New Zealand Earthquake HD Model while managing the Europe Earthquake Model and global earthquake hazard data products. Megan holds a Bachelor’s of Science in geology from Bates College and the RMS Certified Catastrophe Risk Analyst (CCRA®) designation.