logo image

Commentary in the specialist insurance press has generally deemed pricing of catastrophe bonds in 2015 to have bottomed out. While true in average terms, baseline pricing figures mask risk-return values. True risk pricing can be calculated only by considering all dimensions of loss, including seasonal variations and the time value of money. New analysis by RMS does just that, and shows that cat bond pricing has actually been higher in 2015 than it was last year.

Pricing of individual cat bonds is based largely on the expected loss—the average amount of principal an investor can expect to lose in the year ahead. Risk modelers calculate the expected loss for each deal as part of the transaction structuring, but to obtain a market-wide view based on consistent assumptions, we first applied the same model across all transactions to calculate the average expected loss.

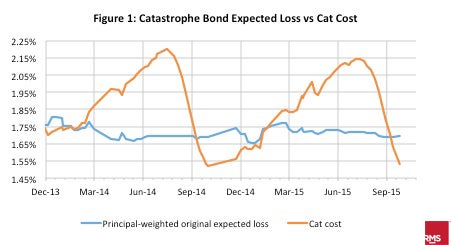
Care must be taken as all loss is not equal, a fact reflected in the secondary-market pricing of catastrophe bonds. Because of the time value of money, a loss six months from now is preferable to a loss today: you can invest the money you are yet to lose, and collect coupons in the meantime. We have calculated the time-valued expected loss across more than 130 issuances in the secondary markets, which we have called Cat Cost. It is dramatically different than unadjusted values, as shown in Figure 1.

blog-miu-catbondcost

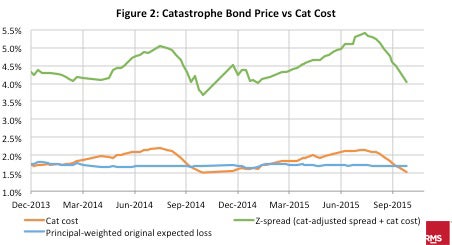
The next step to reveal the true level of cat bond pricing involves accounting for secondary market pricing quotes. Figure 2 plots the same Cat Cost data as Figure 1, but now includes pricing quotes of the bonds, which we gleaned from Swiss Re’s weekly pricing sheets. Also plotted is the “Z-spread”—this is the spread earned if all future cash flows are paid in full and the metric is calculated using a proprietary cash flow model which determines future cash flows (floating and fixed), and discounts back to the current market price. The difference between the two—the space between the top and bottom lines—is the Cat-Adjusted Spread, which measures the expected catastrophe risk-adjusted return.

We can see clearly that on 30 September, 2014 the Cat Cost was 1.53%, identical to the Cat Cost on the same day in 2015. However, this year’s cat-adjusted spread for that day is 2.52%, compared to 2.22% for 2014. In other words, the pricing of cat bonds at the end of the third quarter of 2015 was thirty basis points higher than it was on the same date in in 2014, relative to the risk and adjusted for the time value of money.

blog-miu-catbondcost

The astute will have noticed that the bond spread rises each year as the hurricane season approaches, and falls as it wanes. To account for this seasonal pricing effect, and to reveal the underlying changes in market pricing, we have split the analysis between bonds covering U.S. hurricanes and those covering U.S. earthquakes.

The findings are plotted in Figure 3, and the picture is again dramatic. It is clear that the price of non-seasonal earthquake bonds is relatively static, while hurricane bond prices rise and fall based on the time of year.

blog-miu-useq

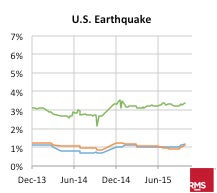
This analysis further shows—for both hurricane and earthquake bonds—that spreads were higher this year than last, relative to adjusted risk. Steep drops in excess returns masked roughly static end-of-year returns in the cat bond market, rather than reflecting a risk-based price decline. Despite the prevailing commentary, the catastrophe bond market is returning markedly more to investors today than it did a year ago, when it bottomed out. But only accurate risk and return modeling reveals the true rewards.

This post is co-authored by Oliver Withers and Jinal Shah, CFA.

Share:
You May Also Like
February 16, 2016
The ILS Community Is Calling Out for Greater Pricing Transparency

I often hear reinsurance underwriters comment on how difficult it is to capture and represent all of the risks underlying a single transaction. Their data comes in many different formats, sometimes from broker or cedants’ own models, which can result in significant differences in modelling assumptions from one transaction to the next. Alongside this, deals almost always include some unmodeled risks like terrorism, aviation or marine. Consolidating all the risks in a transaction into a single view can be frustratingly complex. This was a tolerable situation in the world of traditional reinsurance, when an underwriter’s autonomy and experience carried greater weight, and capital providers—usually shareholders—were less interested in the finer details of the risks. But the world has changed. Today, as collateralized reinsurance and sidecars financed by highly technical investors become increasingly widespread, especially in retrocession markets, better quality data is more important than ever, and often essential to getting the deal done. Furthermore, the Insurance Linked Securities (ILS) market demands valuation of its on-risk investments, as fund managers face increasing pressure from stakeholders (internal compliance, regulators, and especially investors) to have deals marked independently. The challenges The challenge is compounded by capital markets investors’ broadening appetite for reinsurance risk. Both excess of loss layers and quota share deals are in the frame, with the former often covering tail risk with a low probability of attachment, and the latter the full distribution of risks with a high frequency of loss that’s attritional in nature. Deal pricing is fundamentally dependent on the transaction structure. Attachment and exhaustion probabilities determine the likelihood that event losses will trigger and exhaust a layer, and ultimately how losses within a layer will develop over a risk period. Because of this, a time-dependent view of loss development and ‘incurred but not reported’ claims should influence investment valuations. Historically, this has proved difficult to achieve, given the inconsistent data and unmodeled risks typically supplied in a deal submission. Current market solutions employed by fund managers are mainly based on actuarial methods of valuation which do not capture the full risk profile. Cash flow is also critical. Net earned premium should be risk weighted to ensure that future premium cash flow is not accrued before the risk has passed. Set-up costs including brokerage fees, taxes, and others should also be considered. Lastly, pricing models must be dynamic, such that the technical price is updated to reflect actual reported losses, and cash flow forecasts are recalibrated accordingly. Such a view of risk and return – one which is both time and structure-dependent – is fundamental to arriving at the proper valuation of a reinsurance deal in isolation and, also critically, for a portfolio. A uniform procedure for transaction and outstanding deal pricing is therefore crucial to satisfying investors and their stakeholders. We can now achieve all of that easily, regardless of the state of the risk information in hand. RMS’ Miu platform offers a single environment in which to analyse all risks within a transaction, with a new multi-model risk aggregation feature complimented by a pricing service. The simulation-based tool delivers a single, holistic view of the risk in a proposed or live transaction and provides complete portfolio roll-up capabilities. In addition, the RMS mark-to-model pricing service provides weekly marks to support net present value calculations for deals, portfolios, and fund of fund strategies. The solution By using the RMS Miu platform, investors and reinsurers can import loss data in multiple formats, including exceedance probability (EP) curves, results data modules (RDMs), and event loss tables (ELTs), and fold them into a single, comprehensive view of risk. It’s an easy process which can be done while maintaining correlations between peril regions, whether the risk is modeled by RMS or not, capturing correlation of non-modeled risks across deals by defining a baseline view of risk for specific peril regions. The Miu applications enable investors and reinsurers to unify their universe of risk into one place. More broadly, the platform facilitates their ability to model and share ILS reinsurance transactions by providing a single view of risk, in so doing delivering the market transparency that leads to improved pricing certainty, and consequently more capital for the sector. This post was co-authored by Anaïs Katz and Jinal Shah. …

Jinal Shah
Jinal Shah
Director, Capital Markets, RMS

With more than 10 years of experience in the Insurance Linked Securities (ILS) market, Jin is responsible for managing investor relationships and new ILS product development at RMS. During his time at RMS, Jin has led analytical projects for catastrophe bond placements , and has designed new parametric indices to facilitate trading of index-based deals in peak zones, as well as introduced new pricing initiatives to the ILS market. Jin currently focuses on pricing deals and managing portfolios with RMS ILS investor clients, and leads the development of Miu, the RMS ILS portfolio management platform. Jin holds a bachelor's in Mathematics from The University of Manchester Institute of Science and Technology, and a master’s in Operational Research from Aston Business School and is a CFA charter holder.

cta image

Need Help Managing Your Portfolio?

close button
Overlay Image
Video Title

Thank You

You’ll be contacted by an Moody's RMS specialist shortly.